2022-02-17 15:26:08 来源:中国教育在线
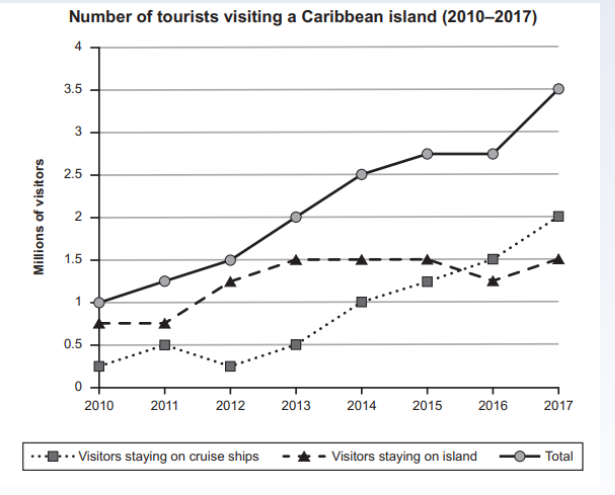
剑桥雅思15Test2写作—曲线图

题目:
The graph below shows the number of tourists visiting a particular Caribbean island between 2010 and 2017.
Summarise the information by selecting and reporting the main features,and make comparisons where relevant.
Write at least 150 words.

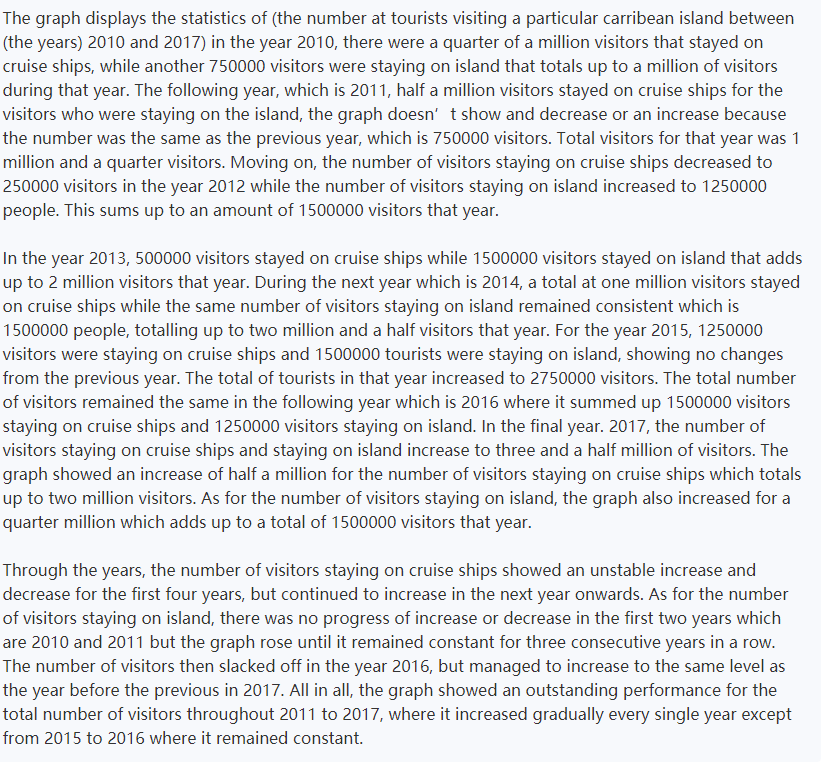
参考范文:


(一)由于考试政策等各方面情况的不断调整与变化,本网站所提供的考试信息仅供参考,请以权威部门公布的正式信息为准。
(二)本网站在文章内容来源出处标注为其他平台的稿件均为转载稿,免费转载出于非商业性学习目的,版权归原作者所有。如您对内容、版 权等问题存在异议请与本站联系,我们会及时进行处理解决。"